Measuring Failure & environment
The Gallagher index provides a measure of the balance between vote share and seat share of an election, and gives an index of how well the electorates’ votes are represented by the ensuing government. A well-balanced election gives a low figure – we have one of the highest values in the democratic world Gallagher Index by Country 2025.
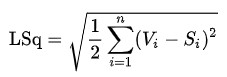
The adjacent formula and following Wikipedia description:
"The Gallagher index is computed by taking the square root of half the sum of the squares of the difference between percent of votes (Vi) and percent of seats (Si) for each of the political parties (i=1,…,n)"
- does not endear itself to none maths enthusiasts. But Sir John Curtis gave a simple explanation when on Matt Frei's LBC programme the morning after the 2024 election, as adjacent clip.
John Curtice's simple alternative is: “the difference between the percentage of seats and votes for each party within an election, added together while ignoring the sign (seats may be more or less than votes), and dividing the result by 2. This is also known as the Loosemore-Hanby index, which gives a measure of “how much the principle of one person, one vote is violated”. The two methods have a similar goal, but AI says: “The use of squares in the Gallagher index means it is more sensitive to large discrepancies between a party's vote share and seat share than the Curtis/Loosemore-Hanby index. It "punishes" large deviations more severely.”
As the Gallagher index is more commonly used I've included it in the election stats, but the Curtis method is shown in the table at No longer fit for purpose - Why it fails.
Note: The index is just a measure of the seat to vote ratio and doesn't necessarily show the whole picture, or the degree of match to voter desires. The figure covers the whole election “warts and all” such as tactical voting (which possibly lowers the index), the acceptance of just 2 parties, or behind the scenes cooperation of tiny parties to beat seat qualifying vote levels. Like all measures and statistics it’s good to look behind the figures e.g. the UK and US below where the good US index results from the electorate locked into 2 parries by the electoral system, and which also gives the UK a bad index as we have a tradition of voting for multiple parties.
Examples of Gallagher Index
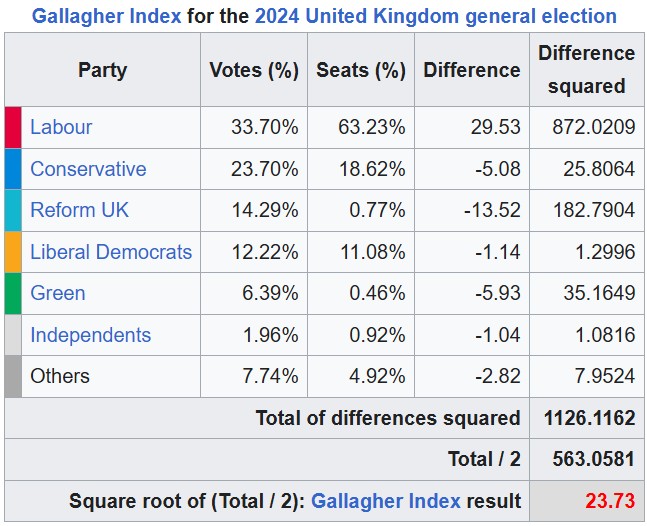
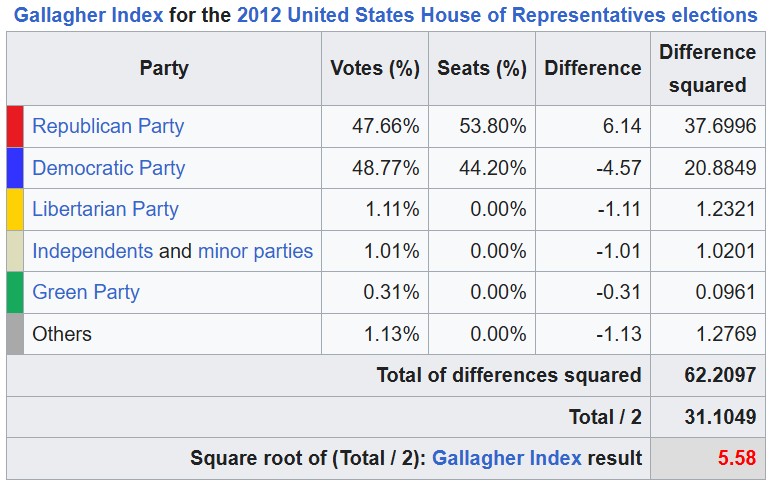
As already mentioned we in the UK have one of the worse levels of disproportion in the democratic world, but surprisingly the US, who use a similar voting system to the UK, come towards the top of the world ranking - the two calculations from Wikipedia are adjacent.
As you can see there’s a simple explanation – the Uk has a spread of votes over 5 parties, some independents, and a significant number of Others who account for more than the Green Party. The differences between vote share and seat share are alarmingly high, resulting from a 2 party voting system being used for multiple parties. In comparison The US shows just 2 parties with the predominant vote (96.4% between them) and with just 1.1% going to the Libertarian Party and 2.5% to others. Here the difference between vote and seat share is low because a 2 party voting system is being used where in reality only 2 parties exist.
The US possibly uses our FPTP winner-take-all style system as a hangover from the British Colonial days, as many our past possessions have done. But here in the motherland we’ve had a long history of class privilege (see History and Other links) and regional disputes, of long standing problems in Ireland, and unrest in Scotland and Wales, which has given rise to local interest parties like the DUP, Sinn Féin, SNP and Plaid Cymru. The Liberal were always significate before morphing into the Lib/Dems and now we have even more parties becoming significant or starting, but not only many parties but also many constituencies for such a small country - 658 in 1801 and 650 in 2024.
In contrast I suggest the US was designed, rather than the UK’s centuries of muddled development, with a written constitution and 2 parties established under a FPTP system. But not only just 2 parties but far fewer "constituencies". The US House of Representatives has 435 voting seats representing congressional districts of approximately 761,169 people on average, which is 10 times the population size of a UK constituency despite the US population being only 5 times the UK's.
Given the number of parties on offer and the number of constituencies in the UK, our political environment is much more diverse and fragmented when it comes to FPTP. Whereas the established political environment of the US means that voters are worried about wasting their vote by voting for anyone other than the 2 parties and so the FPTP 2 party system remains. In the US the voting system is driving the political environment, while in the UK the environment is at odds with the voting system – FPTP is not doing either of us any favours.