Challenge Quiz - What happens
Is FPTP fit for purpose with our modern politics? Below are some prominent general election results - can you say what the Vote Share may have been? Possibly somewhere between 30% to 60%?
After considering what happend and final answers, please go to MVM Resources for the Actual Results and a short explanation as to why majorities do not logically follow vote shares, plus some traditional reasons given for supporting FPTP. A detailed explanation continues here at Analysis - How it happens. Note: nothing sophisticated here, suggest pencil and paper for answers if needed. The normal browser back-arrow should return you from MVM.
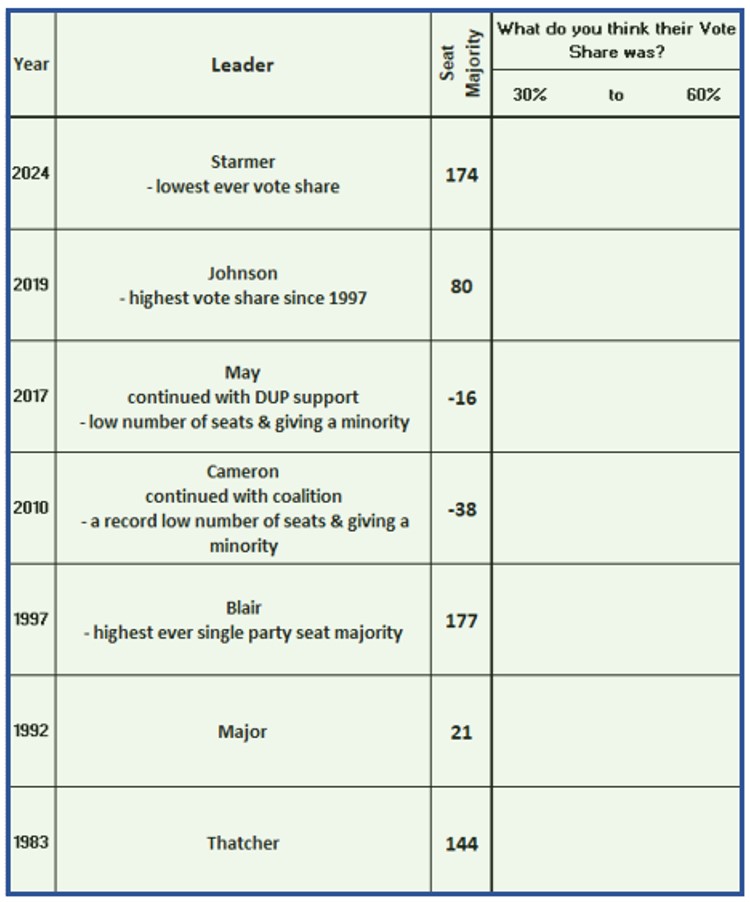
And a Bonus Question: "How many PMs since WW2 have been elected with an overall majority of the vote?"
It's probably best to consider your responses and get the actual results as a direct comparison before continuing below.
Alternative view
Below is an alternative view of the above table, but in the form of a graph where the top line shows the percentage of seats obtained by the winning party, and the lower line the vote share providing the result. A seat percentage above 50% is a majority.
As before it’s difficult to see any consistency between vote share and seat share, and anomalies are just as obvious, such as Thatcher and May getting the same vote share, but with dramatic differences in seat share. The sudden peak in vote share for the coalition is due to LibDem MP seats being elected with a much higher number of votes, and when they are combined with those for Conservatives MPs the result is a high vote share. Averaging the number of party MPs against the party’s votes is a common measure and gives a votes per MP figure. See following Incidentally.
Votes per MP - when using FPTP for multiple parties the average number of votes for a party MP varies dramatically and is offered as a defence of FPTP in that it keeps small parties from gaining power. This may be true, but can be so effective that it forces a 2 party system as in US (see Measuring Failure), and there are better ways to achieve this such as a qualifying minimum vote level. One of the most dramatic cases was in 2015 when UKIP became popular and gained 3,881,099 votes nationally, but it was only in Clacton where they reached critical mass and obtained an MP, and the resulting votes / MP was a massive 3,881,099. At the opposite end is the SNP who are popular, but only in Scotland so their votes are naturally concentrated and easily gain critical mass, and gave them a votes / MP of just 25,972. For comparison the winning Conservatives got 34,241 votes / MP and Labour 40,290. This favouring of local interest parties also happens in Wales and dramatically in Northern Ireland. Remember 2017 when May needed 10 DUP MPs to support her minority government, they added just 292,316 votes, and if it was a formal coalition like the 2010 would raise the vote share by just 2.1%.
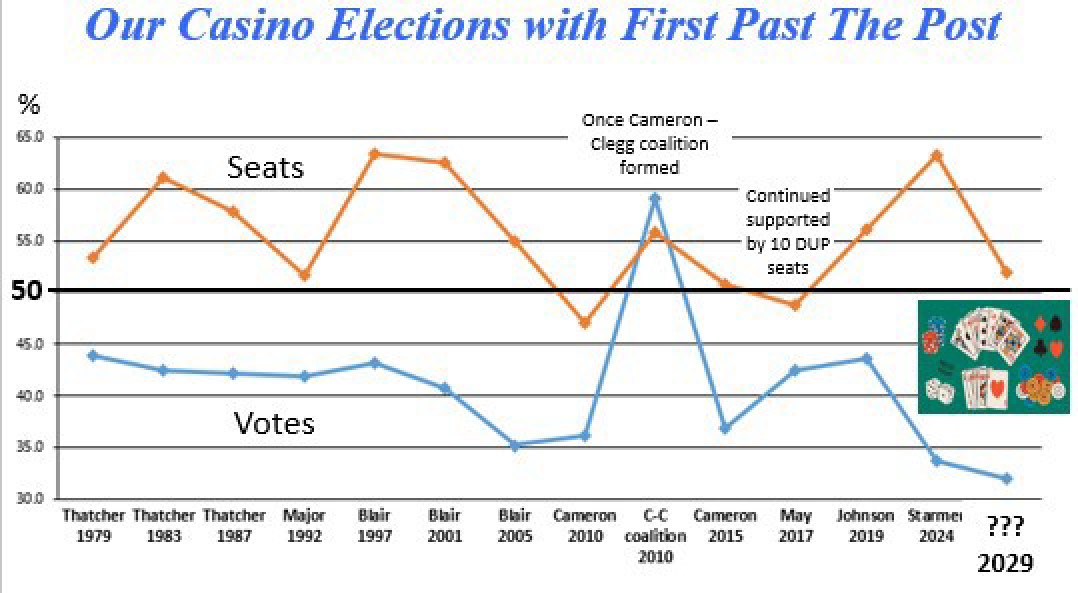
The result suggested for 2029 is what could happen if we contine using FPTP in our fractious political environment - a government with possibly a small majority, but gained with a new record low vote share. The gaming table image alludes to our elections being a poker game undertaken by bluffing players and the winner taking the total pot. We the electorate provide the chips by way of votes, but take little part in the game itself or its result. Instead we need a system where the voter calls the tune and sets the outcome, rather than those with vested interests.